

CXone Performance Management dashboards allow you to display groups of modules![]() A centralized, visual representation of data, such as average hold time (AHT) metrics, or system information, such as personal challenge information.. These modules provide information about your contact center or your personal account. You can use different combinations of modules to display specific types of information. An example could be an agent's personal dashboard. This dashboard could display gamification status, modules to assist day-to-day work, and so forth. A supervisor dashboard could display performance data for all agents on a specific team. You can create templates Dashboards can be effective tools for all roles in a contact center. You can show in-depth metrics for many aspects of your contact center in a convenient location, or assist in everyday workflow.
A centralized, visual representation of data, such as average hold time (AHT) metrics, or system information, such as personal challenge information.. These modules provide information about your contact center or your personal account. You can use different combinations of modules to display specific types of information. An example could be an agent's personal dashboard. This dashboard could display gamification status, modules to assist day-to-day work, and so forth. A supervisor dashboard could display performance data for all agents on a specific team. You can create templates Dashboards can be effective tools for all roles in a contact center. You can show in-depth metrics for many aspects of your contact center in a convenient location, or assist in everyday workflow.
Key Facts About Dashboards
- You can access dashboards through the Home, Dashboard Library, or Dashboard (Legacy) navigation options in the side-menu. Legacy dashboards were created in the old style, and can be migrated into a new, responsive dashboard with updated functionality. Not all modules are available for Legacy dashboards.
- The Dashboard Library offers basic management actions, like copying or sharing, subscribing to reports for the dashboard data, editing the title, and so forth.
- You can create dashboard templates, which are pre-built layouts used as starting points for new dashboards.
- You can share dashboards and dashboard templates to other users. The original creator owns the dashboard and can make changes, but an administrator can change the ownership. Other users can also copy a shared dashboard and make the copy their own.
- You can add modules by clicking the +Add Modules button in the side-menu, then clicking a module from the list.
Dashboard Actions Menu
When you have a dashboard selected, you can click the actions menu icon in the dashboard tab to access quick actions. The following table explains each action you can perform from this menu.
| Menu Action | Description |
|---|---|
| Edit Details | Allows you to edit basic details for the dashboard, such as its name and the categorization folder. |
| Time Zone | Allows you to apply a different time zone to the modules displayed on this dashboard. If your system is set up on the new AX platform, a system administrator can configure additional time zone options. These additional options can be selected here. |
| Subscribe | Allows you to generate and receive reports for the data presented in modules on the dashboard. See the Manage Subscriptions page for more information. |
| Share | Allows other users to also view the dashboard as their own. You can specify which users with whom you want to share the dashboard. Only the dashboard owner can make changes to the dashboard. Typically, the creator is the owner, however ownership can be transferred by an administrator with proper permissions. |
| Dashboard Filter | Allows you to apply specific settings for all modules on the dashboard, such as display data for a specific team or combinations of metrics. See the Configure the Dashboard Filter page for more information. |
| Copy | Creates a new dashboard with all the same modules and settings. |
| Export | Generates an instant report of the data currently displayed on the dashboard. You can choose to export as a spreadsheet with or without objectives. |
| Full Screen | Expand the dashboard to cover your full screen. |
Module Controls and Options
Modules display the data and content for CXone Performance Management dashboards. There are many types of modules, including performance summaries, gauges, thermometers, rankings, and charts. Some modules are designed to display a single metric (such as Current Hold Times), while others allow you to select and compare multiple metrics you want to see in your dashboard (for example, Analytics Trending). Some modules may be available for either responsive or Legacy dashboards, and some may only be available with certain product packages - contact your CXone Account Representative for more information.
Modules displayed on a dashboard have a variety of controls that you can use adjust the display, drill down into the module data, and so forth. The following drop-down explains the most common of these options, however, not all options appear on every module. One or more of the following may appear in the upper right corner of the module:
| Toolbar Icon | Details |
|---|---|
| Search |
Indicated by a magnifying glass; search for specific data inside the module, such as an agent name. |
| Dock | Indicated by an underscore ( _ ). Minimize the module to a docking bar on the bottom of your screen. You can maximize the module on any dashboard that you have open. |
| Expand |
Indicated by two arrows; enlarge the module as a pop out. |
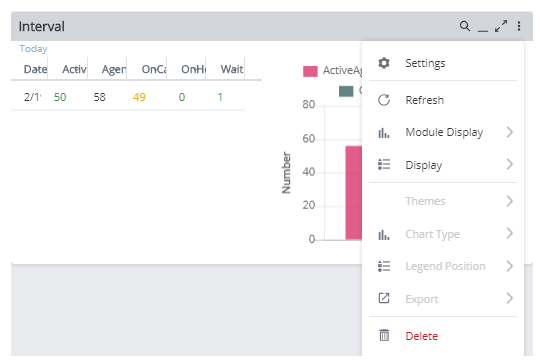
| Actions |
Indicated by 3 dots, the Actions menu enables you to select from the following module related actions: (all actions are not relevant to every module)
|