

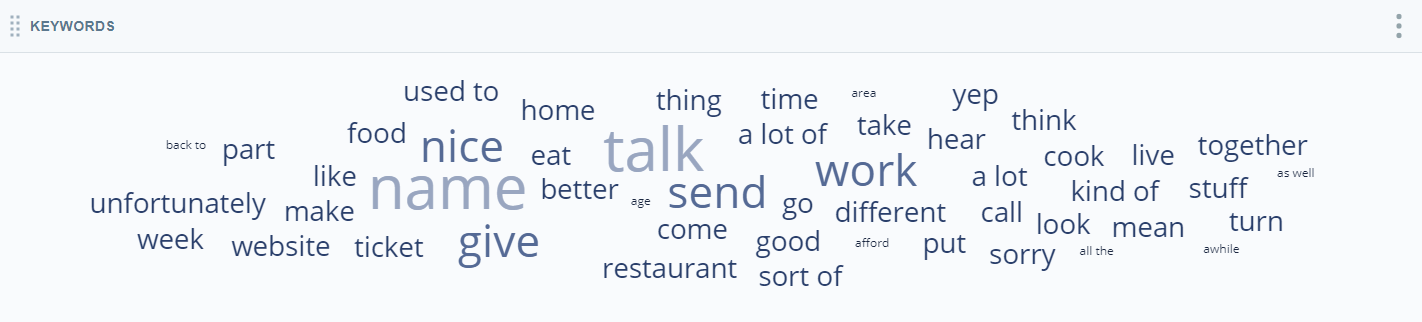
The Keywords Widget displays the single keywords with the largest numbers of occurrences. Unlike the What People Are Talking About Widget, which shows entities![]() Defined keyword or phrase, with or without variants, in an interaction or message, the Keywords Widget counts the number of times the exact keyword appears in the dataset contacts, regardless of context and meaning.
Defined keyword or phrase, with or without variants, in an interaction or message, the Keywords Widget counts the number of times the exact keyword appears in the dataset contacts, regardless of context and meaning.
View Details about a Keyword
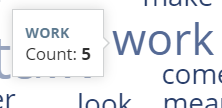
Hover over a keyword in the chart to view information about it, including the name of the keyword and the number of times it appears in contacts in the dataset.
Filter Based on Data in the Chart
You can filter any widget![]() Graphical representation of data that meets specified filter criteria. using the dashboard filter pane on the right side of the page. You can also filter the Keywords Widget based on keywords or phrases in the chart:
Graphical representation of data that meets specified filter criteria. using the dashboard filter pane on the right side of the page. You can also filter the Keywords Widget based on keywords or phrases in the chart:
-
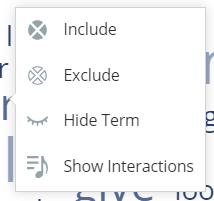
To view data only from contacts that contain one of the keywords or phrases, click the keyword or phrase and select Include or Exclude. The chart refreshes to display the filtered data.
Because you can only have one phrase in the keyword filter at a time, adding a phrase to the filter replaces the current phrase filter, if one exists.
- To view data only from contacts that do not contain one of the keywords, click the keyword and select Hide Term. The chart refreshes to display the filtered data.
Filtering inside the chart is a quick and easy way to apply keyword filters. If you want to modify filters later, use the Keyword drop-down of the dashboard filters pane.
Remove Filters Applied in the Widget
If you applied an include filter to a keyword or phrase in the chart, you can click the keyword or phrase in the chart and select Remove Dashboard Filter.
If you applied exclude filters, or want to remove multiple filters of any type quickly, use the keywords filter to temporarily deactivate or remove any of them. To do so, follow the instructions in Filter Dataset Data for Widgets in the Workspace or Filter Dataset Data for Widgets in the Workspace.
Show Interactions
When you click a keyword on the chart, you can select Show Interactions to open the Interactions Widget in a new window, filtered to include only contacts containing the chosen keyword. For example, if you click the keyword 'sorry', the Interactions Widget opens to display all contacts where the word 'sorry' appears.
You can perform all the same actions in this pop-up that you can in the Interactions Widget. These include:
- Viewing transcripts
- Listening to call recordings
- Highlighting selected items
- Sorting data into your preferred view
For instructions, see Interactions Widget.
Modify the Keywords Widget Settings
You can modify the Keywords Widget settings to apply filters, change the name of the widget in the workspace![]() Named view of one or more widgets., change the color of the keywords, or change the number of keywords that appear in the widget.
Named view of one or more widgets., change the color of the keywords, or change the number of keywords that appear in the widget.
Change the Title of the Keywords Widget
- Click Options
 in the top right corner of the widget.
 - Click Settings.
- Enter the new widget name in the Title field.
- Click OK.
Customize the Keywords Widget
- Click the three stacked dots in the top right corner of the widget.
- Click Settings.
- Click Widget Options to open the drop-down.
- If you want to change the base color of the keywords in the widget, either click the colored box to open the color picker or manually type the hexadecimal code of the color you want to use in the text box.
- If you want to change the number of keywords that appear in the widget, click the Number of Keywords drop-down and select a new number from 10, 20, 30, 40, or 50.
- Click OK.
Export the Keywords Chart as CSV
Data is exported in CSV format.
- Click Options in the top right corner of the widget.
- Click Export
 .
.
Save the Keywords Chart as an Image
Images are exported as PNG files.
- Click Options in the top right corner of the widget.
- Click Save Chart as Image
 .
.