

Required permission: Interaction Analytics View
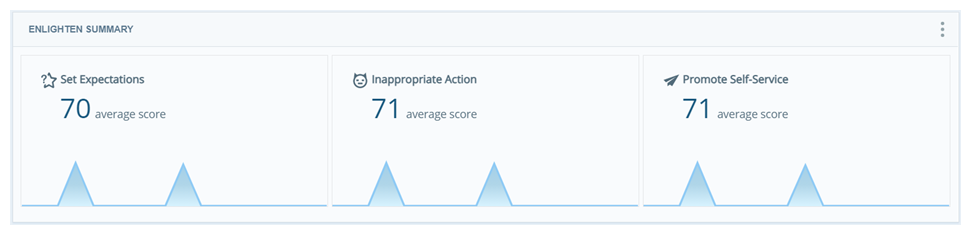
The Enlighten Summary Widget provides a quick look at metrics "badges" for the agent, team, or contact center. The widget also shows a graph so you can see whether the metric is trending up or down. Enlighten metrics are only available for English interactions.
By default, the widget shows the five lowest-scoring metrics. You can change one or more of the displayed metrics in the widget settings, up to a maximum of five of the nine available Enlighten behavioral metrics.
|
Behavior |
how agents can display the Behavior |
|---|---|
| Acknowledge Loyalty | Acknowledge the contact's history with your organization. Show appreciation for their loyalty. |
|
Active Listening |
Respond in the conversation and don't ask the contact to repeat themselves. |
| Be Empathetic | Acknowledge stated issues and how they impact the contact. |
| Build Rapport |
Acknowledge the contact's request. Actively respond in the conversation and don't ask the contact to repeat themselves. |
| Demonstrate Ownership | Reassure the contact that the agent understands the issue and is ready and able to help. |
| Effective Questioning | Ask meaningful questions to explore the contact's experience, issues, or opportunities. |
| Inappropriate Action |
Deny a contact's request to transfer, use inappropriate language, or other offensive acts. While all other behaviors are positive, this is a negative behavior. The gauge color will be green and the score will be high when the agent is not displaying this behavior. |
| Promote Self-Service | Promote the availability of self-service options (such as a website or app). |
| Set Expectations | Summarize actions and next steps. Inform the contact of what to expect or what to do next. |
Read the Widget
You can see the average percentage score for each behavior for your contact center. The scores are color-coded and show a trend line to help you quickly see which behaviors need your attention.
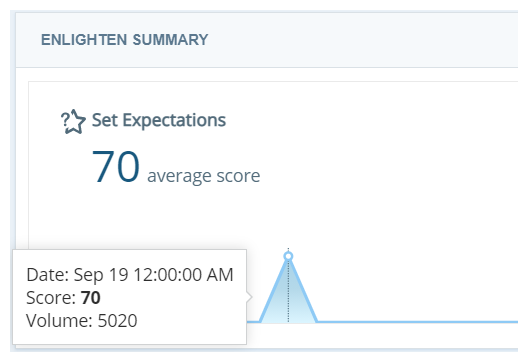
Show Interactions
- Using your mouse, hover over any point in the trend line. A dotted line appears along with a box that shows the Date, Score, and Volume of interactions analyzed for that day.
- Click the dotted line, then click Show Interactions to open the Interactions Widget filtered to show those interactions.
Modify the Metrics Widget Settings
You can modify the Enlighten Summary Widget settings to apply filters, change the name of the widget in the workspace![]() Named view of one or more widgets., and change the displayed badges.
Named view of one or more widgets., and change the displayed badges.
Change the Title
- Click Options
 in the top right corner of the widget.
 - Click Settings.
- Enter the new widget name in the Title field.
- Click OK.
Customize the Enlighten Summary Widget
- Click Options in the top right corner of the widget.
- Click Settings.
- Click the Widget Options drop-down.
- If you want to display badges based on low scores:
- Click the Low Score tab.
- Select a radio button to see badges for the 3 Lowest , 4 Lowest, or 5 Lowest scored behaviors.
- If you want to display badges based on high scores:
- Click the High Score tab.
- Select a radio button to see badges for the 3 Highest, 4 Highest, or 5 Highest scored behaviors.
- If you want to display badges based on something other than score:
- Click the Custom tab.
- Select checkboxes for up to five badges.
- Use the Arrows
 at the right end of a behavior line or Move
  at the left end of a behavior line to order the badges as you want to see them.
- Click OK.
Export the Chart as a CSV File
Data is exported in CSV format.
- Click Options in the top right corner of the widget.
- Click Export
 .
.