

Required permission: Interaction Analytics View
The Enlighten Behavioral Metrics Widget is a bar chart that lets you see agent performance in one or more of the Enlighten behavioral metrics. These metrics are only available for English interactions. You can choose from the following metrics and display them in the order you want.
|
Behavior |
how agents can display the Behavior |
|---|---|
| Acknowledge Loyalty | Acknowledge the contact's history with your organization. Show appreciation for their loyalty. |
|
Active Listening |
Respond in the conversation and don't ask the contact to repeat themselves. |
| Be Empathetic | Acknowledge stated issues and how they impact the contact. |
| Build Rapport |
Acknowledge the contact's request. Actively respond in the conversation and don't ask the contact to repeat themselves. |
| Demonstrate Ownership | Reassure the contact that the agent understands the issue and is ready and able to help. |
| Effective Questioning | Ask meaningful questions to explore the contact's experience, issues, or opportunities. |
| Inappropriate Action |
Deny a contact's request to transfer, use inappropriate language, or other offensive acts. While all other behaviors are positive, this is a negative behavior. The gauge color will be green and the score will be high when the agent is not displaying this behavior. |
| Promote Self-Service | Promote the availability of self-service options (such as a website or app). |
| Set Expectations | Summarize actions and next steps. Inform the contact of what to expect or what to do next. |
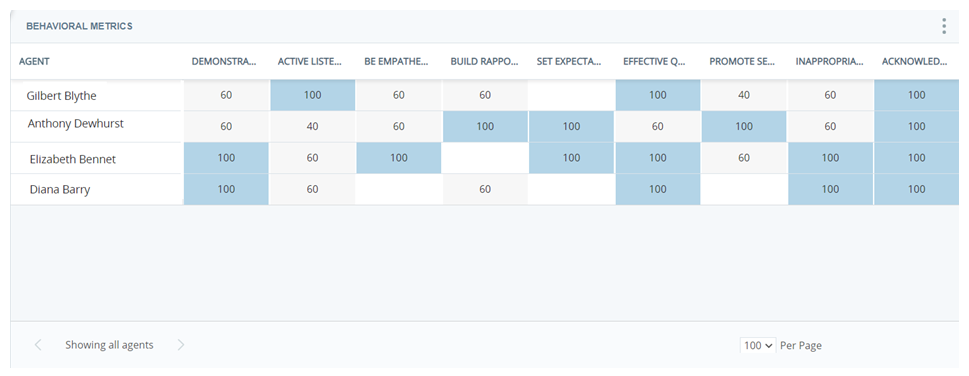
Read the Chart
Each line on the chart represents an agent. You can see the percentage score for that agent for each behavior. The scores are also color-coded to help you quickly see which behaviors the agent needs help with.
Show Interactions
When you click an agent in the chart, you can click Show Interactions to view the interactions that match the metric during this time period. For example, if you click a bar that shows 46 interactions were not abandoned during the time period and select Show Interactions, the Interactions Widget opens to display those 46 interactions.
Modify the Widget Settings
You can modify the Enlighten Behavioral Metrics Widget settings to apply filters, change the name of the widget in the workspace![]() Named view of one or more widgets., and change the displayed behaviors.
Named view of one or more widgets., and change the displayed behaviors.
Change the Title
- Click Options
 in the top right corner of the widget.
 - Click Settings.
- Enter the new widget name in the Title field.
- Click OK.
Customize the Widget
- Click Options in the top right corner of the widget.
- Click Settings.
- Click Widget Options to open the drop-down.
- If you want to change the behaviors that show in the widget, click the Select Columns drop-down. Select the checkboxes for the behaviors you want to see. Clear the checkboxes for behaviors you don't want to see.
- If you want to group the behaviors in the display, click the Group By drop-down, then click Agent, Team, or Category.
- Click OK.
Export the Chart as a CSV File
Data is exported in CSV format.
- Click Options in the top right corner of the widget.
- Click Export
 .
.
Save the Chart as an Image
Images are exported as PNG files.
- Click Options in the top right corner of the widget.
- Click Save Chart as Image
 .
.