This page provides general instruction for accessing and configuring modules. For specific information regarding the customization options for a specific module, see the reference topic for that module, such as the process of creating website modules.
If you have Digital First Omnichannel enabled for your organization, you can integrate that data into your CXone Performance Management system. The following metrics are specific to data from digital channels:
Cases
|
Metric |
Details |
|---|---|
| Opened Cases | Count of how many cases are currently being worked on. |
|
Resolved Cases |
Count of how many cases have been resolved or closed. |
| Escalated Cases | Count of how many cases require attention from agents or managers due to an issue. |
| Trashed Cases | Count of cases that have failed. |
| Response Rate per Case | Number of responses that a case currently has. |
| Avg Agent Response per Case | Average number of agent responses that a case has. |
| Avg Customer Response per Case | Average number of customer responses that a case has. |
| Sum of Unread | Number of unread messages that all cases currently have. |
| Sum of New Cases | Count of how many cases that are marked as a new case. |
| Sum of Pending Cases | Count of how many cases that are marked as pending. |
| Sum of Escalated Cases | Count of how many cases that are marked as escalated. |
| Number of Messages in a Case | Average count of how many total messages are in a case. |
| Agent Response in Cases | Count that uses buckets to show how many agents that have had contact with a case. The possible outputs for this are 1-2, 2-3, 3-4, 4-6, 6-11, and 11+. |
| Close without Response | Number of cases that are closed without any interaction from an agent. |
| (FCR) First Call Resolution | Number of cases that are moved to the resolved state with only 1 session from an agent. |
| Multiple Touches | Number of cases that have been responded to by multiple agents. |
| Outbound Volume | Number of cases where an agent was first to make contact. |
Sentiments
|
Metric |
Details |
|---|---|
| Positive | Count of how many cases are currently analyzed (customer and their correspondence) as being "positive". |
|
Neutral |
Count of how many cases are currently analyzed (customer and their correspondence) as being "neutral". |
| Negative | Count of how many cases are currently analyzed (customer and their correspondence) as being "negative". |
| Satisfaction Level | Current sentiment state for a case. 3 possible states are: positive, neutral, and negative. |
Time
|
Metric |
Details |
|---|---|
| Avg Resolution Time | Time taken to move the state of a conversation to resolved. |
|
Average Agent Time to Response |
Time taken for an agent to respond to a conversation. |
| Time to First Response | Time taken for an agent to respond to a conversation the first time. |
| Average FRT (First Response Time) | Average amount of time taken for an agent to respond to a case for the first time. Possible outputs are 0-1 min, 1-10 min, 10-20 min, 20-30 min, 30-60 min, and 60+ min. |
| Avg Resolution | Average amount of time taken for a case to be moved to a resolved state. Possible outputs are 0-1 min, 1-10 min, 10-20 min, 30-60 min, and 60+ min. |
- Open a dashboard.
- Click + Add Modules in the side-menu to display a list of modules.
-
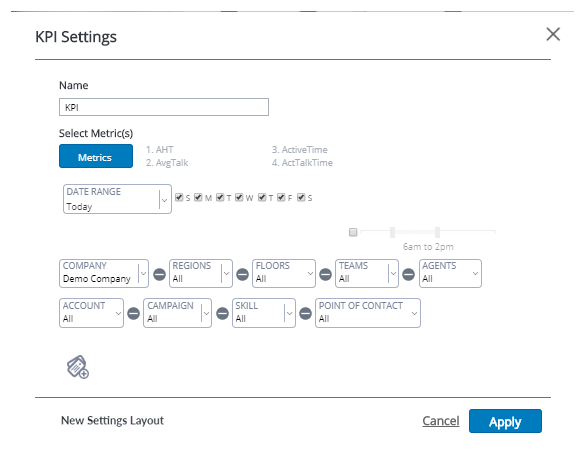
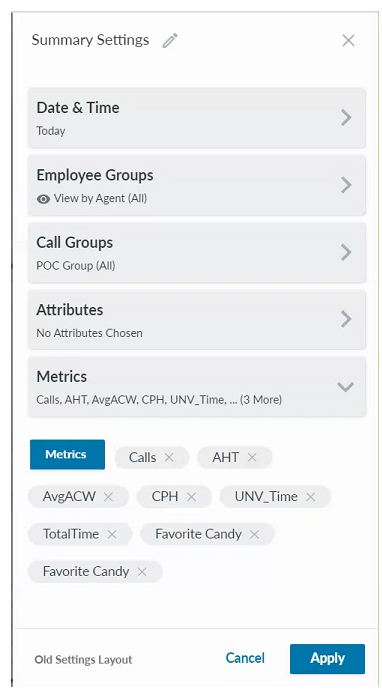
Click a module to open it in the dashboard or click and drag it to your desired location on the dashboard. The settings window will automatically open after it is placed on your dashboard. You can view the settings window in the old pop-up window or the new slide-out window.
- Configure the date filter to determine the time range for which you want to display data. If the date range you select is requesting too much data, an error message will appear to advise you so you can adjust your configurations.
- Configure employee-based or call-based filters.
- Configure other settings, if any, such as adding data attributes for reporting purposes.
-
 Configure the module metrics (if the module includes this option).
- Click Metrics in the settings window to open the metrics window.
- Select the metrics that you want to view in this module. After selecting a metric, it will appear in the Selected column. To remove a metric from your selections, click the X for the metric.
-
If you selected a time-based metric, you can change the time format. The time metric in the Selected column contains a drop-down that presents the different format options. You can change the format on a metric-level, so different time metrics can display in different time formats. When creating metrics, you can determine the default format.

- You can also add a metric type to your favorites list by clicking the star next to the metric.
- Click Confirm. The metrics you selected display next to the Metrics button.
- Click Apply.
You can click and hold along the top of the module and drag it to a new location on your dashboard. Existing modules on your dashboard may automatically shift to accommodate a new layout. You can edit the module metrics by clicking the bullet list in the right corner of a module and clicking Settings.


