

The Sentiment Trend Widget displays the sentiment![]() Overall mood or result of the interaction as determined by analysis of words, phrases, and context of the transcript. Interactions can be positive (blue), negative (red), frustrated, mixed (dark gray), or neutral (light gray). of contacts over time. You can drill down to see what happened in spikes of certain sentiments. Some spikes are just increases in call volume, but the chart can show when the number of positive or negative calls fluctuates and allows you to investigate the cause.
Overall mood or result of the interaction as determined by analysis of words, phrases, and context of the transcript. Interactions can be positive (blue), negative (red), frustrated, mixed (dark gray), or neutral (light gray). of contacts over time. You can drill down to see what happened in spikes of certain sentiments. Some spikes are just increases in call volume, but the chart can show when the number of positive or negative calls fluctuates and allows you to investigate the cause.
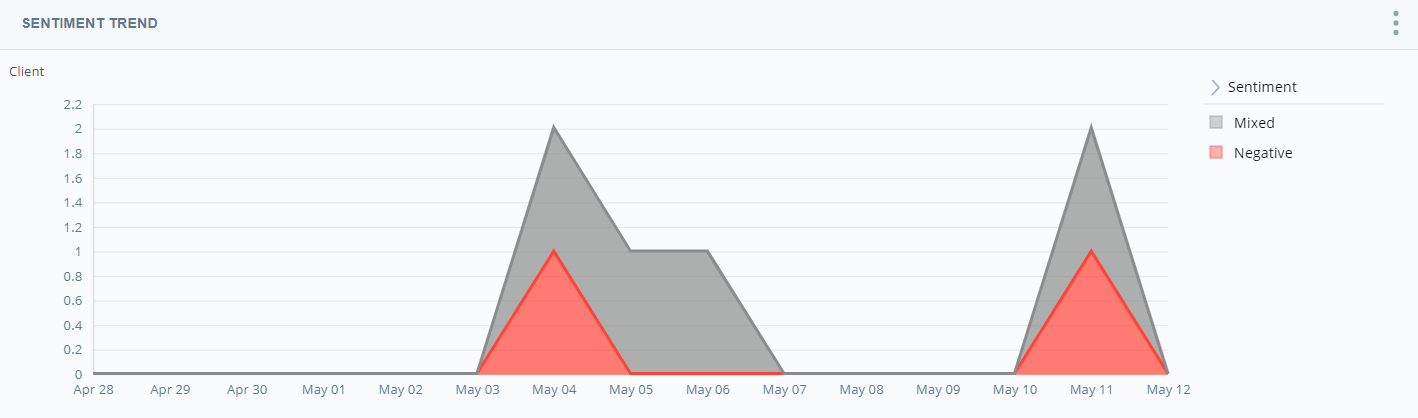
Read the Chart
Sentiment![]() Overall mood or result of the interaction as determined by analysis of words, phrases, and context of the transcript. Interactions can be positive (blue), negative (red), frustrated, mixed (dark gray), or neutral (light gray). is color-coded consistently in Interaction Analytics so that any sentiment data in the charts is represented by the following color assignments:
Overall mood or result of the interaction as determined by analysis of words, phrases, and context of the transcript. Interactions can be positive (blue), negative (red), frustrated, mixed (dark gray), or neutral (light gray). is color-coded consistently in Interaction Analytics so that any sentiment data in the charts is represented by the following color assignments:
- Negative — red
- Positive — blue
- Mixed — dark gray
- Neutral — light gray
The vertical measurement is the number of contacts that occurred and the horizontal measurement is time. If you are looking at a short period of time, it is in hours and if you are looking at a long period of time, it is in days. Any point on the chart is the number of calls per sentiment that occurred on a certain day or at a certain time.
When you hover over a colored area of the chart, you can see the date and time the contacts occurred and number of contacts that occurred per sentiment at the time.
Show Interactions
When you click a colored area on the chart, you can select the sentiment type you want to use to filter the contacts. You can select Positive, Negative, Neutral, or Mixed. The Interactions Widget opens in a new window, filtered to display only contacts from that time with the sentiment you chose. For example, if you click an area on the chart and select Negative, the Interactions Widget opens to display all contacts with a negative sentiment that occurred during the time you selected.
You can perform all the same actions in this pop-up that you can in the Interactions Widget. These include:
- Viewing transcripts
- Listening to call recordings
- Highlighting selected items
- Sorting data into your preferred view
For instructions, see Interactions Widget.
Modify the Sentiment Trend Widget Settings
You can modify the Sentiment Trend Widget settings to apply filters, change the name of the widget in the workspace![]() Named view of one or more widgets., and specify whether the sentiment displayed in the widget is the agent's or the contact's.
Named view of one or more widgets., and specify whether the sentiment displayed in the widget is the agent's or the contact's.
Change the Title of the Sentiment Trend Widget
- Click Options
 in the top right corner of the widget.
 - Click Settings.
- Enter the new widget name in the Title field.
- Click OK.
Change Whose Sentiment Displays in the Sentiment Trend Widget
- Click the three stacked dots in the top right corner of the widget.
- Click Settings.
- Click Widget Options to open the drop-down.
-
Click the Participant drop-down and select whether you want the Agent or Client sentiment to appear in the widget.
- Click OK.
Export Sentiment Trend Chart as CSV
Data is exported in CSV format.
- Click Options in the top right corner of the widget.
- Click Export
 .
.
Save Sentiment Trend Chart as an Image
Images are exported as PNG files.
- Click Options in the top right corner of the widget.
- Click Save Chart as Image
 .
.