

This widget allows you to identify the most commonly unresolved categories![]() Data groups that Interaction Analytics uses for parsed call transcript data. They make it easier to find trends. of interactions impacting your contact center. These categories are shown within the context of average talk time. The widget offers both a category view and agent view. The category view provides insight into what kinds of issues are frequently not resolved in a single interaction. The agent view can help pinpoint which agents might be struggling to resolve contact concerns in a single interaction.
Data groups that Interaction Analytics uses for parsed call transcript data. They make it easier to find trends. of interactions impacting your contact center. These categories are shown within the context of average talk time. The widget offers both a category view and agent view. The category view provides insight into what kinds of issues are frequently not resolved in a single interaction. The agent view can help pinpoint which agents might be struggling to resolve contact concerns in a single interaction.
Read the Widget
Categories View
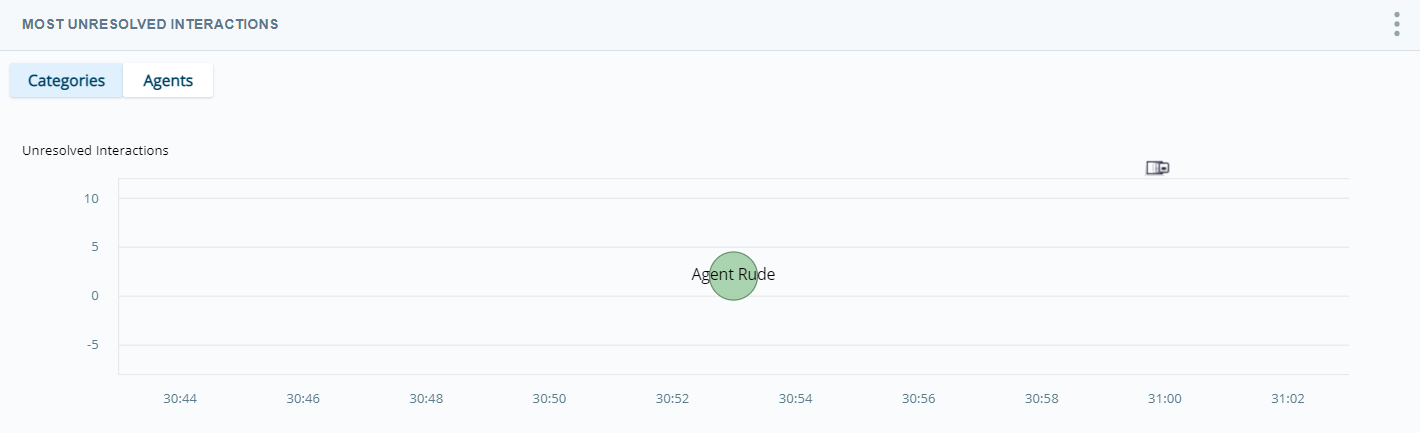
Each bubble represents a category. The left axis indicates the total number of unresolved interactions. The bottom axis shows average talk time for interactions for that category.
- To view details about a category, hover over its bubble in the chart. A tooltip displays the category name, number of unresolved interactions, and the average talk time for that category.
- To see which agents handled the unresolved interactions in that category, click Show Agent. The table displays the names of the agents who handled the interactions, the number of interactions per agent, each agent's average talk time per category, and how far off each agent is from the overall average talk time for that interaction type.
Agents View
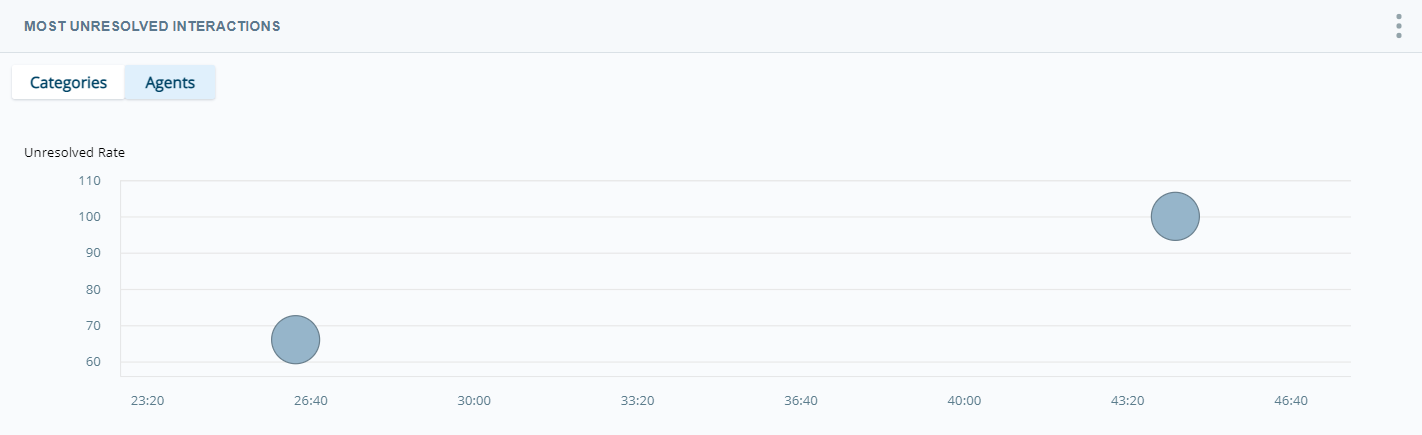
Each bubble represents an agent. The left axis indicates the percentage of unresolved interactions for that agent. The bottom axis shows average talk time for interactions handled by that agent. When you hover over an agent's bubble in the chart, you see details about the agent's unresolved interactions. These details include the agent's name, the percentage of interactions the agent handled that were unresolved, and the average talk time of the interactions the agent handled.
Show Interactions
You can view the transcripts for an unresolved category![]() Data groups that Interaction Analytics uses for parsed call transcript data. They make it easier to find trends. or agent by clicking the category or agent bubble in the chart and selecting Show Interactions. A pop-up containing the corresponding interactions appears.
Data groups that Interaction Analytics uses for parsed call transcript data. They make it easier to find trends. or agent by clicking the category or agent bubble in the chart and selecting Show Interactions. A pop-up containing the corresponding interactions appears.
You can select what you want to highlight in the transcript. For example, if you click Intent to Buy Competitor Products and select Show Interactions, the pop-up contains all transcripts in the dataset that fall under that category.
You can perform all the same actions in this pop-up that you can in the Interactions Widget. These include:
- Viewing transcripts
- Listening to call recordings
- Highlighting selected items
- Sorting data into your preferred view
For instructions, see Interactions Widget.
Modify the Widget Settings
You can modify the widget settings to:
- Apply filters
- Change the widget title as it appears in the workspace
 Named view of one or more widgets.
 - Change the default view
- Change the colors of the bubbles in each view
Change the Title of the Widget
- Click Options
 in the top right corner of the widget.
 - Click Settings.
- Enter the new widget name in the Title field.
- Click OK.
Customize the Widget
- Click Options in the top right corner of the widget.
- Click Settings.
- Click Widget Options to open the drop-down.
-
If you want to change whether the Categories or Agents view displays by default, select either Categories or Agents under Default View.
- If you want to change the base color of the bubbles in the widget, you can:
- Click the colored box to open the color picker and select a color, or
- Manually type a hexadecimal color code in the text box
You can specify a different color for the Categories view and the Agents view by modifying the Category Color and Agent Color, respectively.
- Click OK.
Specify Categories to Display
You can choose up to 10 specific categories to display. The widget then shows only those categories in the Categories view. In the Agents view, the widget only shows unresolved interactions in those specified categories handled by the displayed agent. All other unresolved interactions under different categories are filtered out of both views of the widget.
- Click Options in the top right corner of the widget.
- Click Settings.
- Click Widget Options to open the drop-down.
- Clear the Display Top Categories checkbox.
- Navigate the category folders or use the search bar above the category list to locate the categories you want to include in the widget. Select the checkbox next to each category you want to include. A counter to the right of the Display Top Categories checkbox displays how many of the 10 maximum categories you have selected.
- Click OK.
Specify Agents to Display
You can choose up to 10 specific agents to display. The widget then shows only those agents in the Agents view. In the Categories view, the widget only shows unresolved interactions for those specified agents in the displayed categories in the Categories view. All other unresolved interactions under different agents are filtered out of both views of the widget.
- Click Options in the top right corner of the widget.
- Click Settings.
- Click Widget Options to open the drop-down.
- Clear the Display Top Agents checkbox.
- Use the search bar above the agent list to locate the agents you want to include in the widget. Select the checkbox next to each agent you want to include. A counter to the right of the Display Top Agents checkbox displays how many of the 10 maximum agents you have selected.
- Click OK.
Export the Widget Data
Data is exported in CSV format.
- Click Options in the top right corner of the widget.
- Click Export
 .
.
Save the Widget as an Image
Images are exported as PNG files.
- Click Options in the top right corner of the widget.
- Click Save Chart as Image
 .
.