

Intraday Manager is available only for environments that are using NICE CXone ACD or Cisco UCCX.
Intraday gives you a 24-hour look at your day, from 12:00 AM to 11:45 PM. The day is split into 15-minute intervals. Using the intervals and metrics![]() Statistics you can measure to keep track of your contact center, you can see how each skill
Statistics you can measure to keep track of your contact center, you can see how each skill![]() An employee's area of expertise. A skill can be fluency in a specific language or business skills, such as sales or technical support. is performing. You can also compare them with the forecasted data, and spot areas where you may need to update your scheduling.
An employee's area of expertise. A skill can be fluency in a specific language or business skills, such as sales or technical support. is performing. You can also compare them with the forecasted data, and spot areas where you may need to update your scheduling.
Let's say your center has three skills: Inbound phone, Chat, and Tech Support. You forecasted that your center would receive 100 calls and 50 chat requests per hour during the morning shift. But what if something unexpected happens? At 11:00, you see that you received only 20 calls per hour, but 90 chat requests. You might want to adjust your staffing. You can reduce staffing for the Inbound Phone skill, and free up more time for your agents to handle chat requests.
Features in the Intraday Manager:
-
Widgets–The top of the page displays a row with Intraday data in different graphs.
-
Intraday table–Underneath the widgets you get a detailed look at the data with exact numbers.
More about Intraday:
-
The table displays data for inbound interactions
 Conversation with an agent through a channel. For example, an interaction can be a voice call, email, chat, or social media conversation. only (and not outbound or deferrable Interactions that can be handled later, such as emails. interactions).
 -
By default, all skills and metrics are displayed in the table when you open Intraday Manager. You can filter the data you want to view. Next time you enter Intraday, you'll see the skills according to what you filtered.
-
You can collapse the widget row by clicking Options
 > Collapse Widgets.
Reforecast
Reforecast gives you a new, updated forecast for the rest of the day. The reforecast is based on the original forecast and the current actual trend from the ACD. This way, you can get a more accurate forecast as the day goes on and you collect more ACD data. If you reforecast earlier in the day, the initial reforecasted values will not be as accurate as the values later on.When you enable reforecasting:
Each widget displays another graph for reforecasting data.
The Reforecast
A new forecast for the rest of the day, based on incoming data from the ACD. Records data only when Reforecast is enabled. and New Variance The difference between the reforecast and the actual trend coming from the ACD. Records data only when Reforecast is enabled. columns are added to the Intraday table.
You can reforecast only when:
There's a forecast to base it on.
You're looking at the present workday.
Widgets
These are the widgets in the Intraday Manager: Open Agents Variance, Volume![]() The total volume of interactions (such as calls and chats) at a specific time Variance, AHT
The total volume of interactions (such as calls and chats) at a specific time Variance, AHT![]() Average handle time. This is the average amount of time an agent spent handling an interaction. Variance. The widgets display trends based on actual working hours of your organization, and not full days. This way you get an optimized view of the chart.
Average handle time. This is the average amount of time an agent spent handling an interaction. Variance. The widgets display trends based on actual working hours of your organization, and not full days. This way you get an optimized view of the chart.
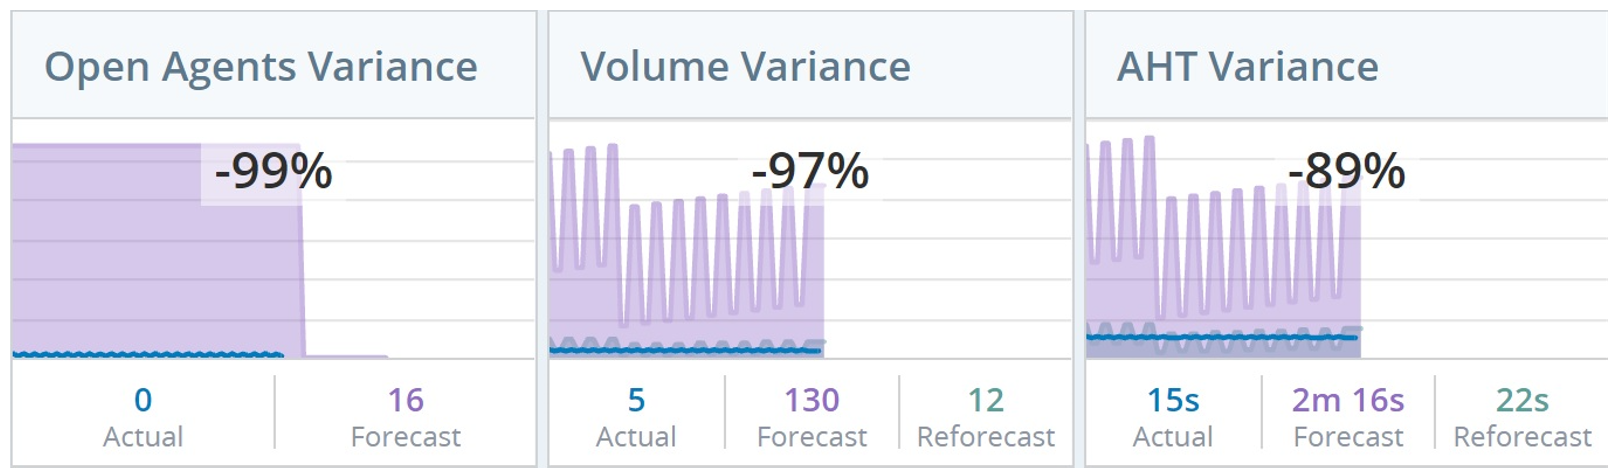
The Actual, Forecast, and Reforecast values. The values come from the Intraday table. The table shows data for every completed 15-minute interval. The values you see in the widget are the same values from the last completed interval.
Let's say you open the Intraday Manager at 11:22. The widgets display the values from the 11:00 row in the table.
The variance percentage between the Actual and the Forecast value. This is the number in the center of each widget.
If you look at the Open Agents Variance widget, you can see that the Actual value is 20 and the Forecast is 50. The variance percentage displayed in the widget is -60%.
Line graphs for the values, measured over the time of the day. The color of each graph represents a different value.
Each graph displays the volume of the value (vertical axis) with 15-minutes intervals (horizontal axis).
Dotted lines in the graphs mean that there is no data for that time.
The data changes when you change the day you choose to display. If you're looking at:
Today—The graphs display data from the beginning of the day until your current time.
Tomorrow—The graphs display data only for Forecast, if available.
A future day—The graphs don't display data.
A day in the past—The graphs display all the data from that day, with a red line that corresponds with the current 15-minute interval. The Actual, Forecast, and Reforecast values are according to that red line.
Intraday Table
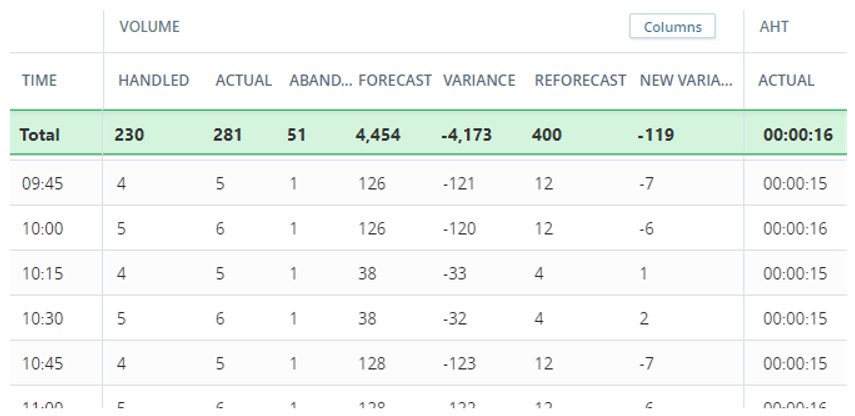
The table displays a breakdown of metrics in 15-minute intervals for the selected day. The highlighted Total row displays the aggregated results of each column. For the AHT and ASA metrics, this is an aggregated average.
Let's say you open the Intraday Manager at 11:22. The table displays data for each interval up to the 11:15 row. The Total row displays the aggregated results of each column from the morning until 11:22.
You can filter which metrics and columns are displayed.
To expand the table by collapsing the widget row, click Options > Collapse Widgets.
What You See in the Table
The actual column in the table displays data for the inbound interactions![]() Conversation with an agent through a channel. For example, an interaction can be a voice call, email, chat, or social media conversation. only (and not the outbound or deferrable
Conversation with an agent through a channel. For example, an interaction can be a voice call, email, chat, or social media conversation. only (and not the outbound or deferrable![]() Interactions that can be handled later, such as emails.).
Interactions that can be handled later, such as emails.).
Metrics in the table:
AHT—This is the average handle time. This is the average amount of time an agent spent handling a contact.
ASA—This is the average speed of answer. This is the average amount of time it took an agent to answer an interaction after they chose the option to speak to an agent.
Actual—The current value for the metric as it comes in from the ACD.
Forecast—The original forecasted value for that time of the day.
Variance—The difference between the actual and forecasted values.
Reforecast—A new forecast for the rest of the day, based on incoming data from the ACD. Shows data only when reforecast is enabled.
New Variance—The difference between the reforecast and the actual trend coming from the ACD. Shows data only when reforecast is enabled.
This is the service level agreement. This is the percentage of total interactions that agents handled within the defined service level agreement threshold.
For example, you want your agents to answer calls within 20 seconds. If your agents answered 60 out of 100 calls within 20 seconds, the SLA is 60.
Actual—The current value for the metric as it comes in from the ACD.
Forecast—The original forecasted value for the metric as it comes in from the forecasted staffing plan.
Keep in mind that the SLA value here is defined when forecasting, while the SLA value for the actual column comes from the ACD. This means that there might be different values for the same metric.
Let's say that the SLA in ACD is defined as answering 80% of the calls within 60 seconds, and that it's defined as 80% in 120 seconds in the staffing plan. In this case, the actual value and the forecasted value will be different.
When you look at the values in the column, you see two numbers. For example, 80/30. The first value is the SLA, and the second value is how quickly you want your agents to handle the interaction. So the example would mean, answer 80% of the interactions within 30 seconds.
Variance—The difference between the actual and forecasted values.
Reforecast—A new forecast for the rest of the day, based on incoming data from the ACD. Shows data only when reforecast is enabled.
New Variance—The difference between the reforecast and the actual trend coming from the ACD. Shows data only when reforecast is enabled.
The volume metric is the total volume of interactions (such as calls and chats) at a specific time.
Columns in the table:
Handled—The number of interactions that were handled every 15 minutes.
Actual—Number of interactions that were handled and abandoned every 15 minutes.
Abandoned—Number of interactions that were abandoned every 15 minutes.
% Abandoned—The percentage of abandoned calls every 15 minutes.
Forecast—The original forecasted value for that time of the day.
Variance—The difference between the actual and forecast values.
Reforecast—A new forecast for the rest of the day, based on incoming data from the ACD. Shows data only when reforecast is enabled.
New Variance—The difference between the reforecast and the actual trend coming from the ACD. Shows data only when reforecast is enabled.
Columns in the table:
Actual—The number of agents that were open within that time interval.
See more details and examplesThe number of agents is calculated by call volume and their handled time within that time interval.
Examples:
Your call center received five calls between 11:15 and 11:30. The average handle time (AHT) for those calls is 15. This means that during that interval, your agents were handling calls for 75 minutes (5 calls × 15 AHT = 75 minutes).
In this case, Intraday will display 5.00 in the actual column (75 minutes agents were handling calls ÷ 15 minutes in the interval = 5).
Required—The number of agents required to handle the interactions (such as calls and chats) within that time interval. The number comes directly from the forecast or staffing plan used to generate the schedule.
See examplesLet's say:
You expect to handle six calls in a 15-minute interval. The average call takes 10 minutes. This means that during the 15-minute interval, your agents need to be available for 60 minutes (10 minutes per call × 6 calls = 60 minutes).
In this case, the required staffing will be 4.00. Why? Because four agents handling interactions for 15 minutes equals 60.
You expect to handle seven calls in a 15-minute interval. The average call takes 10 minutes. This means that during the 15-minute interval, your agents need to be available for 70 minutes.
In this case, the required staffing will be 4.67 (70-minute total handling time ÷ 15-minute interval = 4.67).
Scheduled—The number of agents that are scheduled to be open to handle interactions within that time interval.
See examplesLet's say you have four agents open during a 15-minute interval:
This means that your agents will be open for a combined 60 minutes during that 15-minute time interval. The staffing you see in the tooltip is 4.00. Why? Because the 60 combined minutes that they're open, divided by the interval's 15 minutes, equals 4.
During that time, two of those agents will have a ten-minute break. This means that your agents will be open for a combined 40 minutes during that 15-minute time interval. The staffing you see in the tooltip is 2.67. Why? Because the 40 combined minutes that they're open, divided by the interval's 15 minutes, equals 2.67.
Actual Variance—The difference between the actual number of open agents and the required number from the forecast.
Scheduled Variance—The difference between the original number of agents scheduled to be open and the required number from the forecast.
More information about:
If you see an empty cell:
- In the Actual column, it means that no data was received from the ACD. In this case, contact your administrator.
- In the Forecast column, it means that you did not do a forecast for this day, or that it's outside business hours.
In the Reforecast column, it means that an internal error occurred. Click Reforecast again. If this does not solve the issue, contact your administrator.
The data changes when you change the day you choose to display. If you're looking at:
Today—The table displays data from the beginning of the day until your current time.
Tomorrow—The table displays data only scheduled and forecast data (if they are available).
A future day—The table doesn't display data.
A day in the past—The table displays all the data from that day.
Export Intraday Data
You can export the data from the Intraday Manager grid to a CSV file.
The exported CSV displays the values for time in seconds.
In the top right of the page, click Options
> Export.Define the date range for your export.
Select the Skills and Metrics you want to export data for.
The Export Intraday Data window opens with the filters set to whatever you defined in the Intraday Manager, but you can change them.
Click Export.
The intraday data is exported to a CSV file and downloaded to your computer.