

Report source: DW
Report refresh rate: 1 hour
The Billing report shows usage information that affects your tenant's![]() High-level organizational grouping used to manage technical support, billing, and global settings for your CXone environment monthly charges. The highest daily fair peak for the days of the month is what is billed for concurrent agents. It can also show an administrator the billing costs associated with running the system. This report shows 45 days of data at a time, even if your selected date range is longer than 45 days. For example, if you ran the report for the last three months of the previous year, you will only be able to see usage for the beginning 45 days of the range.
High-level organizational grouping used to manage technical support, billing, and global settings for your CXone environment monthly charges. The highest daily fair peak for the days of the month is what is billed for concurrent agents. It can also show an administrator the billing costs associated with running the system. This report shows 45 days of data at a time, even if your selected date range is longer than 45 days. For example, if you ran the report for the last three months of the previous year, you will only be able to see usage for the beginning 45 days of the range.
The Billing report breaks the billing information into sections, accessible through the different tabs:
Ports Tab
The Ports tab shows the number of ports![]() Where information transfers, over a network, between a computer and a server. being used for the date range.
Where information transfers, over a network, between a computer and a server. being used for the date range.
The Ports tab displays the number of ports![]() Where information transfers, over a network, between a computer and a server. being used for the specified date range. The concurrent model is the only model that bills ports based on usage. This model is billed by the maximum number of ports used during the month. Most other models bill based on the number of configured ports.
Where information transfers, over a network, between a computer and a server. being used for the specified date range. The concurrent model is the only model that bills ports based on usage. This model is billed by the maximum number of ports used during the month. Most other models bill based on the number of configured ports.
- The green bar represents the peak number of concurrent ports for the date range.
- The red line represents the limit of ports allowed in the tenant
 High-level organizational grouping used to manage technical support, billing, and global settings for your CXone environment. If the number of concurrent ports reaches the limit, then calls cannot be made into or out of the contact center. Incoming callers would hear a busy signal; outgoing calls would fail.
 - The gray bar represents the concurrent number of ports used by the
Users Tab
The Users tab shows the total number of users during the date range.
Stations Tab
The Stations tab shows the number of stations being used for the date range. Stations are billed by maximum number of configured stations during the month.
- The green bar represents the peak number of configured, active stations for the date range.
- The red line represents the limit of stations allowed in the tenant High-level organizational grouping used to manage technical support, billing, and global settings for your CXone environment. If the number of total stations reaches the limit, then additional stations cannot be created - including agent-created stations, which may prevent agents from logging in.
- The gray bars represent the total number of configured, active stations created for the
- The dark gray area represents the number of stations created by agents who log in using a phone number instead of a station. As long as such an agent is logged in, the phone number they logged in with is considered a unique station for billing purposes - an agent-created station. If the phone number used has a configured station associated with it, then the station will be reconciled and not billed twice.
Disk Usage Tab
The Disk Usage tab shows the amount of disk usage being used for the date range.
- The green bar represents the peak of total disk usage for the date range.
- Total Disk Usage represents the sum of File Transfers, Call Recordings Digital recording of a conversation between a caller and an agent., and User-created Files, in gigabytes.
- The dark gray bar represents the number of gigabytes used to store files created by the tenant High-level organizational grouping used to manage technical support, billing, and global settings for your CXone environment; typically these files include prompts, scripts, images, log files, etc.
- The gray bar represents the number of gigabytes used for call recordings; stored in the CallLogs directory.
- The light gray bar represents the number of gigabytes used on the CXone FTP servers.
If you use Cloud Storage Services for data storage, your graph will show active, long-term, and long-term retrieval. You can switch between the storage types by using the Disk and Cloud buttons in the upper left corner of the screen.
- Active represents short-term file storage optimized for quick searching and rapid access.
- Long-term represents cost-effective long-term storage for file archiving requirements.
- Long-term retrieval represents the number of gigabytes used for retrieving files from long-term storage.
The Cloud button will only be available if the Cloud Storage option is enabled in your tenant![]() High-level organizational grouping used to manage technical support, billing, and global settings for your CXone environment.
High-level organizational grouping used to manage technical support, billing, and global settings for your CXone environment.
Logins Tab
The Logins tab shows the number of unique logins being used for the date range.
- The green bar indicates the total billing amount for the logins.
- The light gray bar indicates the total number of unique agent logins during the billing cycle.
- The dark gray bar indicates the total number of supervisor logins during the billing cycle.
Skype for Business Users Tab
Displays the number of Skype for Business users during the selected time range.
Email Users Tab
Displays the number of email users during the selected time range.
Chat Users Tab
Displays the number of chat users during the selected time range.
Voicemail Users Tab
Displays the number of voicemail users during the selected time range.
Work Item Users Tab
Displays the number of work item users during the selected time range.
Personal Connection Users Tab
Displays the number of Personal Connection users during the selected time range.
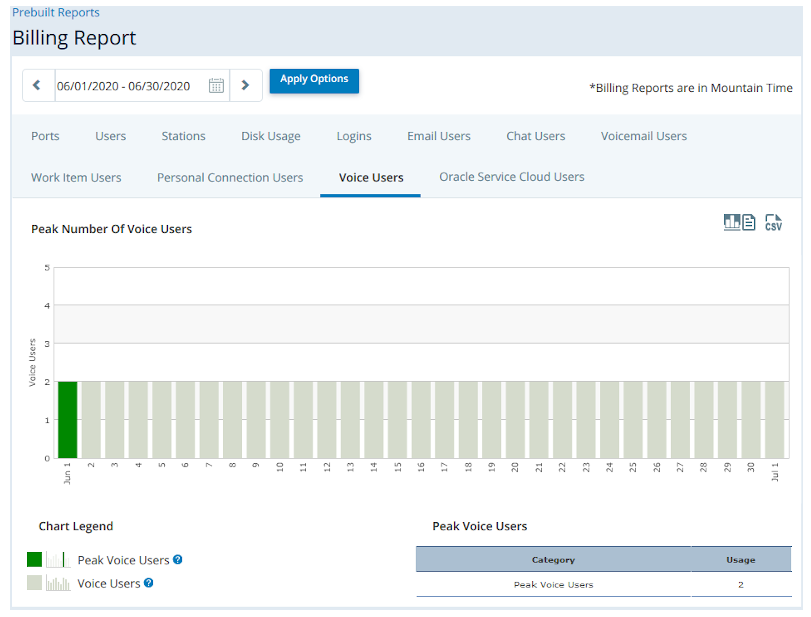
Voice Users Tab
Displays the number of voice users during the date range.
- The green bar represents the peak number of configured, active users for the date range.
- The red line represents the limit of users allowed in the business unit High-level organizational grouping used to manage technical support, billing, and global settings for your CXone environmenttenant High-level organizational grouping used to manage technical support, billing, and global settings for your CXone environment. If the number of users reaches the limit, then additional users cannot be created.
- The gray bars represent the number of configured, active users for the business unit High-level organizational grouping used to manage technical support, billing, and global settings for your CXone environmenttenant High-level organizational grouping used to manage technical support, billing, and global settings for your CXone environment.
Oracle Service Cloud Users Tab
Displays the number of Oracle users during the date range.