

Report source: Tubes
Report refresh rate: 6 hours
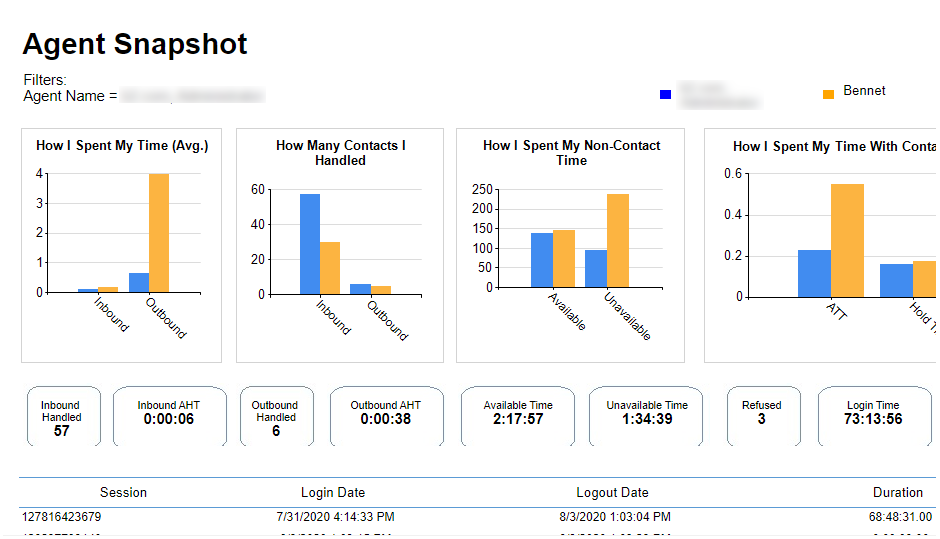
The Agent Snapshot report is designed to bring all of the key metrics concerning an agent’s performance into an intuitive, easy-to-read, actionable report.
Graphs
Graphs provide visual comparisons between the agent and the team average in several key performance metrics that allow the agent to determine how they are performing in relation to the team as a whole.
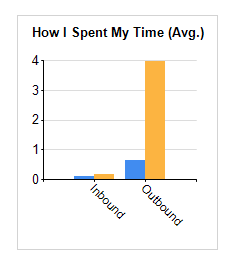
This chart compares the time in hours that the agent spent handling contacts versus the average handle time for the agent's team.
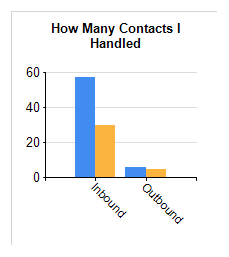
This chart compares the total number of contacts the agent handled versus the total number of contacts handled by an average team member.
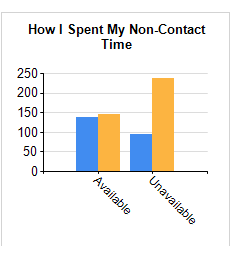
This chart compares an agent to an average team member in how they spend their time when not handling a contact. The Available and Unavailable times are shown separately, with the ACW![]() State that allows an agent to complete work requirements after finishing an interaction. time broken out into its own view.
State that allows an agent to complete work requirements after finishing an interaction. time broken out into its own view.
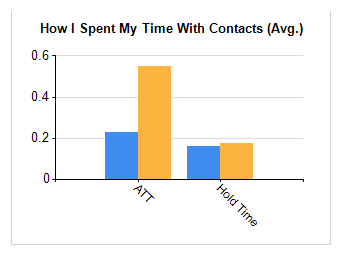
This chart compares an agent to an average team member in how they spend their time while handling a contact. Contact-related ACW![]() State that allows an agent to complete work requirements after finishing an interaction. will also be shown if applicable.
State that allows an agent to complete work requirements after finishing an interaction. will also be shown if applicable.
Metrics
Metrics display a snapshot of the agent’s performance in a number of key areas, allowing for a quick assessment of the agent.

|
Metric |
Details |
|---|---|
| Inbound Handled | Total count of inbound contacts handled by the agent. |
|
Inbound AHT |
Average handle time of all inbound contacts handled by the agent. |
| Outbound Handled | Total count of outbound contacts handled by the agent. |
| Outbound ATT | Average talk time of all outbound contacts handled by the agent. |
| Available Time | Total time that the agent spent in the available state |
| Unavailable Time | Total time that the agent spent in the unavailable state. |
| Refused | Total count of contacts refused by the agent. |
| Login Time | Total time that the agent spent logged in to the platform |
| Occupancy | Percentage of time agents spend handling contacts, otherwise known as agent utilization. |
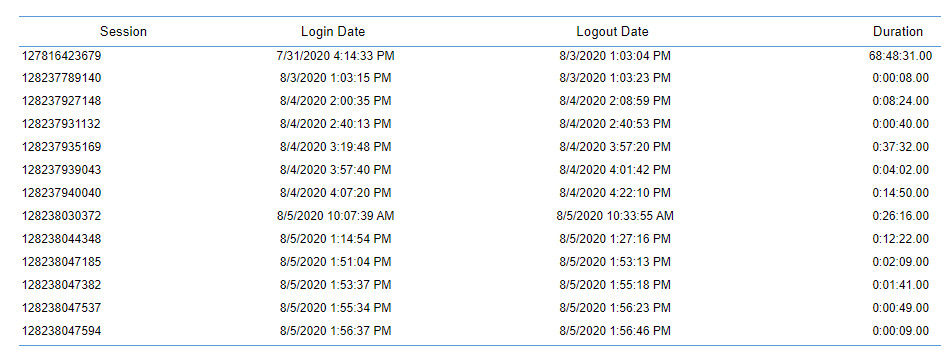
Timecard
Timecard shows when an agent has been logged in to the platform. This allows for easy validation against an agent’s scheduled working time.
|
Column |
Details |
|---|---|
| Session ID | Unique ID given to the agent’s login session within the platform. |
|
Login Date |
Date and time that the login session started. |
| Logout Date | Date and time that the login session ended. |
| Duration | Total length of time that the agent was logged in. |