

Prebuilt business intelligence (BI) reports provide you with advanced data-analysis capabilities. They allow you to view and analyze data from your organization, generating actionable insights across teams and channels. These reports offer additional functionality compared to standard reports. You can perform a variety of actions, listed below, that enhance your ability to display and manipulate data.
BI reports contain separate sections called widgets. You could think of a BI report like an interactive dashboard targeted at specific data. The different widgets or a report display nuanced slices of data, giving you a broader look at the information you're analyzing.
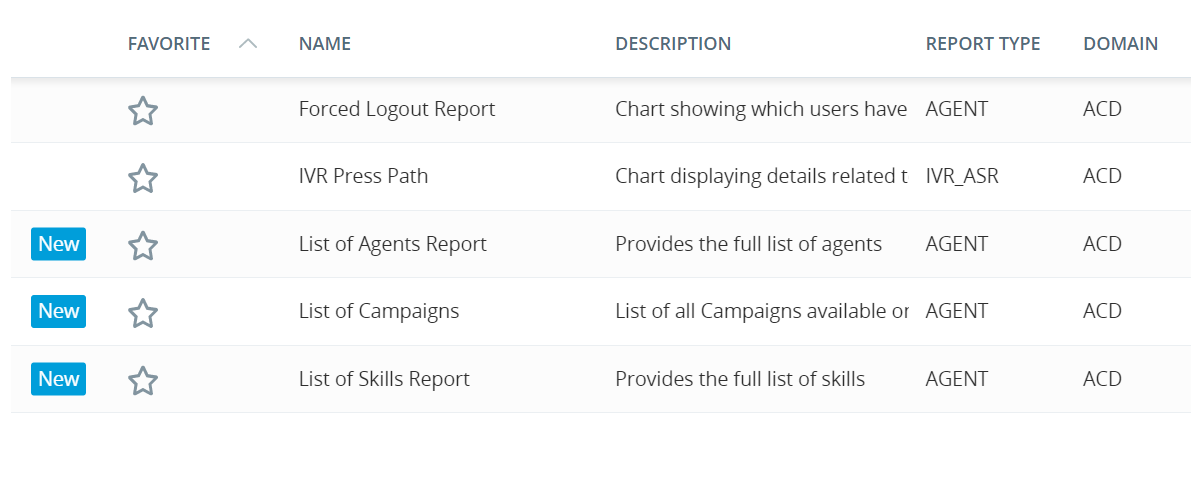
Prebuilt BI reports are indicated with the blue New icon in the prebuilt reports table:
To give users access to BI reports, you must enable General BI Permissions in the user's role, and also enable the Can View BI Reports in the employee profile.
BI Report Actions
The following lists actions you can perform in a BI report, which are different from standard report functionality.
The first time you open a BI report, you are prompted to select your report parameters. These are the general settings by which you want to filter, such as date ranges and teams. These selections apply to all widgets in the report. You can select more granular filters within these parameters using the filter  in the header. All parameters, filters, and sorting save when you close the report. The saved items automatically display the next time you open the report. You can change the report parameters by clicking the Re-prompt
  or Reset
  icons in the header.
You can also save specific filter settings as a bookmark. You can access these bookmarks with the bookmark icon  in the report header, along with the other filter options. Bookmarks are user-specific, so an individual user can personalize their report experience.
Similar to a filter, you can drill-down into specific data by clicking on elements within each widget. For example, in the Evaluations by Team report, you could select a specific team to view data for all interactions each agent handled within the selected team (within your selected dates).
Currently, you can create a View that limits the interaction data by team. For now, this capability is only supported in the Recording Activity report.
Right-click on column headers or within a row to open a menu with additional actions.
You can export data for the entire report, or an individual widget.
To export all report data, click Share  in the top-right corner and select your desired export format. You can export the report as a spreadsheet or PDF.
To export only a widget's data, click the Options icon  and select Export > Excel/PDF/Data.
Open any widget in its own window, including graphic widgets (which open as a grid). When you open a widget in its own window, you can add columns and data to get a broader view.
In the top right of the widget, click the Options icon and select Show Data.
You can export the widget data with your additions directly from this window from the Export Data drop-down in the top right of the window.
Click the Expand icon  to view a widget in full-screen.
Click and drag over an area of the graph to filter by only the selected data. Other widgets in the report will display data based on your selection.
Many BI reports have more than one page. The overview page of a report gives you a general view of the data, but some reports have additional pages for viewing specific agent details.
You can access agent details when widgets include a View link next to the agent's name. Click View to open a specific report for that agent.