

Metrics are statistics that can be measured and tracked to monitor and improve the performance of your contact center. They can be related to products, quality, efficiency, time, objectives, dispositions, or awards, or can be completely custom. Some metrics, such as number of calls, are simple numeric values. Other metrics, such as average handle time (AHT), are calculated based on other metrics. Metrics are used to create custom reports, display data through dashboard modules, set objectives and so forth.
Only administrators (or users) with expert knowledge of reporting metrics and data should have access to creating and configuring metrics.
This topic explains how to create a metric, how to add components to a metric, and how to assign a metric to user groups or campaigns![]() A grouping of skills used to run reports..
A grouping of skills used to run reports..
Depending which platform you are on, setting up and configuring metrics may be performed on one of two possible pages. This topic contains two sets of instructions, one for either platform. If you are on the new (AX) platform, use the Create Metrics (AX) section below. If you have not yet migrated onto the new platform, use the Create Metrics section further down this topic.
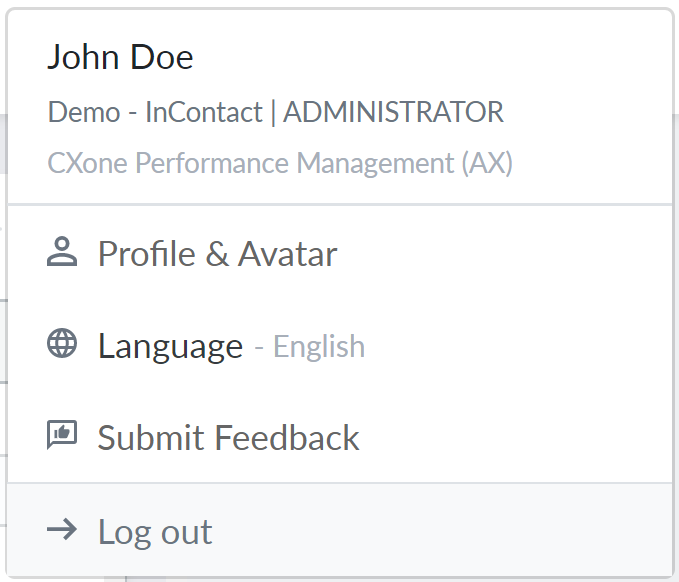
You can see which platform you are on by clicking your profile drop-down in the top-right corner. Your version will be listed below your account name (as shown in the following image).
John Doe is on the new platform, indicated by the (AX) after CXone CXone Performance Management.
Create Metrics (AX)
The following sections apply if you are on the new platform.
Configure New Metric
- Click Data Config > Pipeline Config in the navigation side-menu.
- Click + Add New on the Metric Definitions tab.
- Define the basic Properties of the new metric:
 Learn more about fields in this step:
Field Details Visible in Selector Determines if this metric is selectable when configuring metrics in modules, objectives, games, and so forth. This setting is enabled by default. Full Metric Name The complete name of the metric, such as Average Handle Time. Abbreviation An abbreviation of the full name, such as AHT (for Average Handle Time). If Visible in Selector is enabled, the metric is listed in metric selectors under this name. Description Details about the metric, such as a basic definition, formula for the calculation, and so forth. Employee Hierarchy Determines the employee group(s) for which the metric applies. Select the lowest level within the group hierarchy. Recording Hierarchy Determines the recording/call group for which the metric aplies. Select the lowest level within the group hierarchy.
Some metrics do not apply to both the Employee and Recording/Call groups, nor do they apply to every level within the group hierarchy. Specifying the group and level(s) to which the data applies ensures that the metric is disabled in the metric selector when configuring an incompatible group.
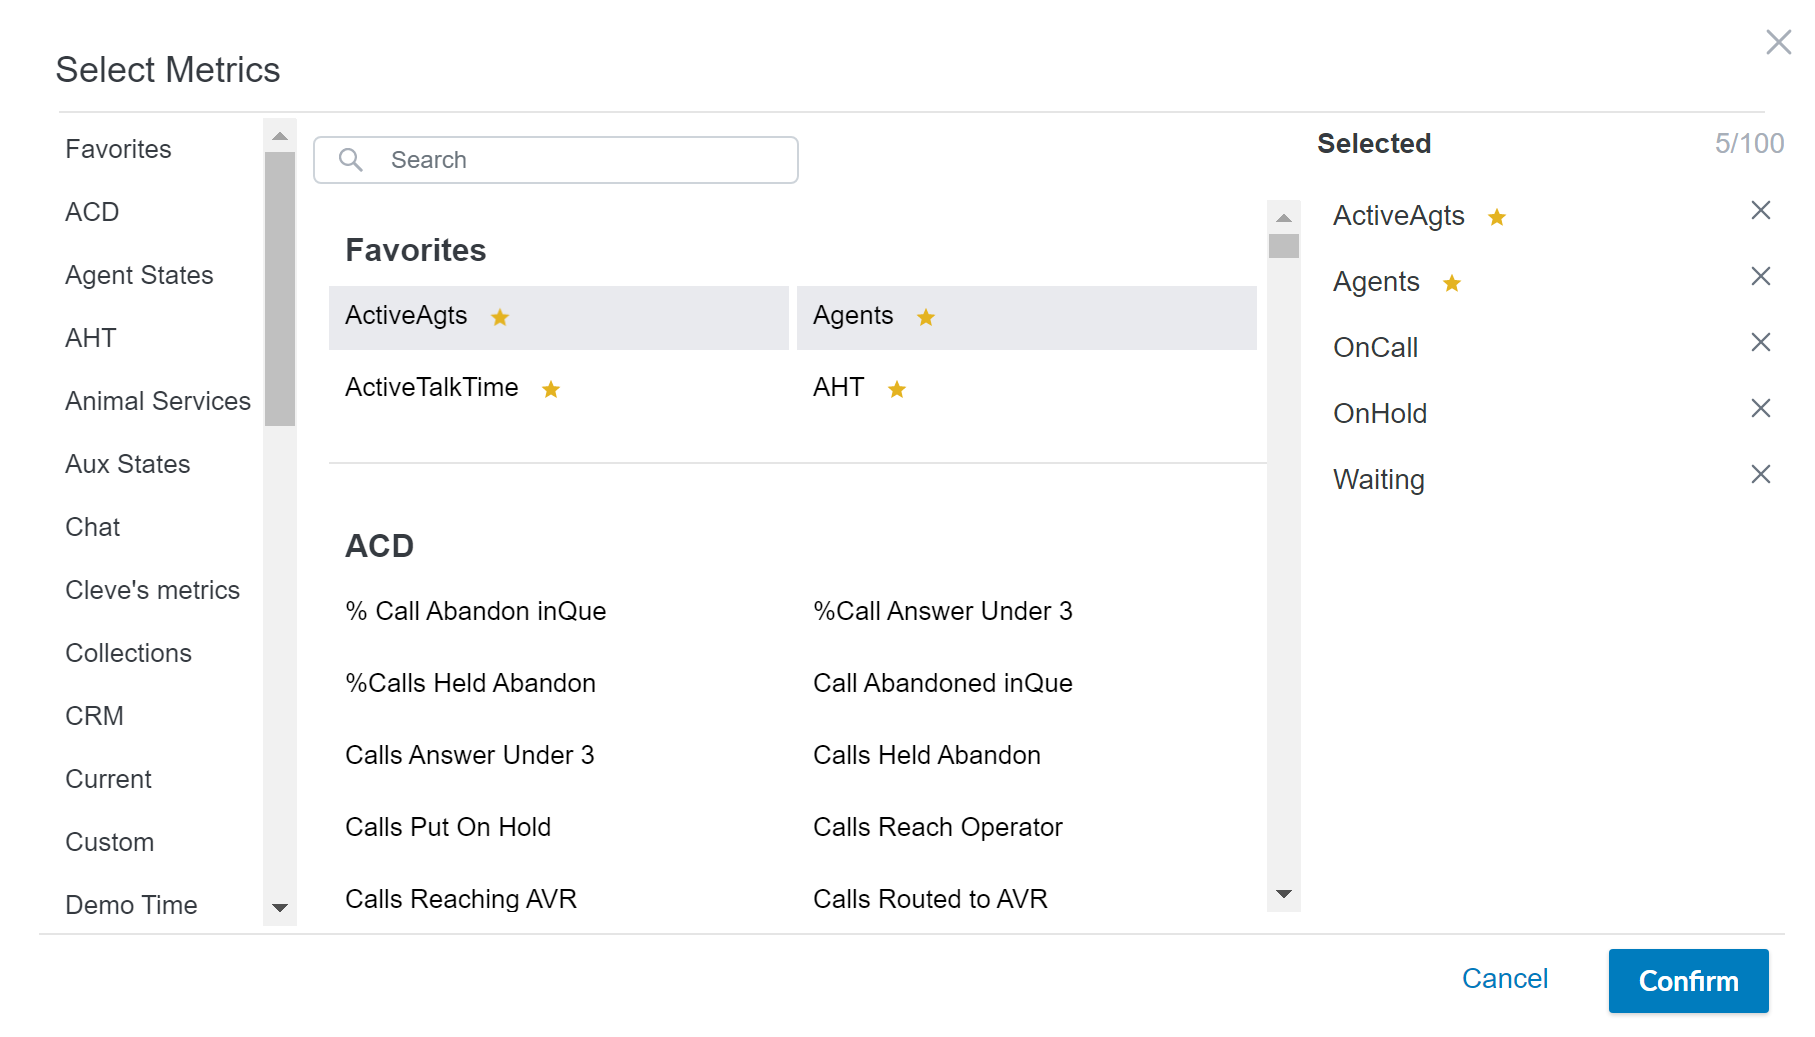
Category The section under which the metric is categorized in the metric selector. View imageThe left-most column of the following image shows the categories by which metrics are organized in the metric selector.
Direction Determines the desired goal for the data (Up or Down). For example:
Agents work to increase the number of calls handled for the Handled Calls metric, therefore, the data value is moving up, from low to high. Or, for the metric AHT, agents want to decrease the average time it takes to handle a call. The data value is moving down, from high to low.
Aggregation - Sum — displays a sum of all values that match the metric definition criteria for a specific date range.
- Max — displays the single highest value from all records that match the metric definition criteria for a specific date range.
Format How the data will display in a module, wallboard, and so forth. Options are: Time, Currency, Number, or Percent. Icon An identifying image for the metric, most commonly used on the KPI module.
Add Components
Components are the building blocks of the metric and indicate exactly from where the data is pulled and how the data is calculated, filtered, and displayed.
- Select a Component Type from the drop-down.
Learn more about fields in this step:
Field Details Standard Metrics To display historical data. A standard metric may consist of one or more components that are each based on a metric start date. Calculated Metrics Create a mathematical formula as the metric component, which is then used to calculate the metric value. Existing metrics along with basic mathematical operations may be used to construct the formula. Snapshot Metrics To display real-time data. A snapshot metric is meant to display a current running total and may consist of one or more components that are not bound to a date. - Click + Component.
- Configure the Component Settings, which differ based on the component type.
- Select a Reporting Set from which data will be pulled.
- Select a Metric Value:
- Data Field — metric value will be pulled from the specified field in the reporting set.
- Time — metric value will equal the time difference between a start and end date.
- Count — metric value will equal the number of instances that occur on or after the start date (start date selected in the Metric Date drop-down).
- Determine the start date (Metric Date) that you want to pull data and the reporting set field (Data Value) from which you want to pull data.
- Select a Calculation Condition for the component: (component data will be either added to or subtracted from the overall metric value)
-
If you want to add a filter field: (allows you to create even more precise metrics by assigning a specific attribute to the metric data, such as Direction, State, Media Type, and so forth)
- Click + Add New Filter Field.
- Select a Data Field from the drop-down.
- Text Field — filter by a text-based data field. Determine if the text is equal or not to a specified value. The Value is the text-based value by which you want to filter.
- Integer Field — filter by a numerical data field.
- Boolean Field — assign a true or false value to the data field.
- Select or enter a Value by which you want to filter.
- Determine the Operator for the Value, such as equal to (=), greater than or equal to (≥), or other.
- If you want to, add additional values by which to filter by clicking Add Value and repeating the previous 2 steps.
- Click Save Changes.
- Click Metrics to add an existing metric as part of your formula.
- Create your formula in the formula box below. You can use your keyboard and/or click any of the Operators, Functions, and Variables links to the side to populate the selected shortcut into the formula box. You can hover over a shortcut to view a brief description.
- Select the Reporting Set from which data will be pulled.
- Select a Metric Value type and choose a Data Value from the drop-down:
- Data Field — metric value is pulled from a specified field in the reporting set and does not include a time parameter.
- Count — metric value equals the number of instances that occur and does not include a time parameter.
- Select a Calculation Condition for the component: (component data will be either added to or subtracted from the overall metric value)
- If you want to add a filter field: (allows you to create even more precise metrics by assigning a specific attribute to the metric data, such as Direction, State, Media Type, and so forth)
- Click + Add New Filter Field.
- Select a Data Field from the drop-down.
- Text Field — filter by a text-based data field. Determine if the text is equal or not to a specified value. The Value is the text-based value by which you want to filter.
- Integer Field — filter by a numerical data field.
- Boolean Field — assign a true or false value to the data field.
- Select or enter a Value by which you want to filter.
- Determine the Operator for the Value, such as equal to (=), greater than or equal to (≥), or other.
- If you want to, add additional values by which to filter by clicking Add Value and repeating the previous 2 steps.
- Click Save Changes.
- If you want to add group assignments to the metric, move on to the next section, otherwise, click Save to finish creating the new metric.
If your formula is mathematically incorrect, an error message will display.
Add Assignments
By default, the newly-created metric is assigned to all users, however, if you want to assign the metric to specific groups:
- Click Edit Assignments in the metric properties.
- Select specific groups by filtering through the group selector.
- Click Save.
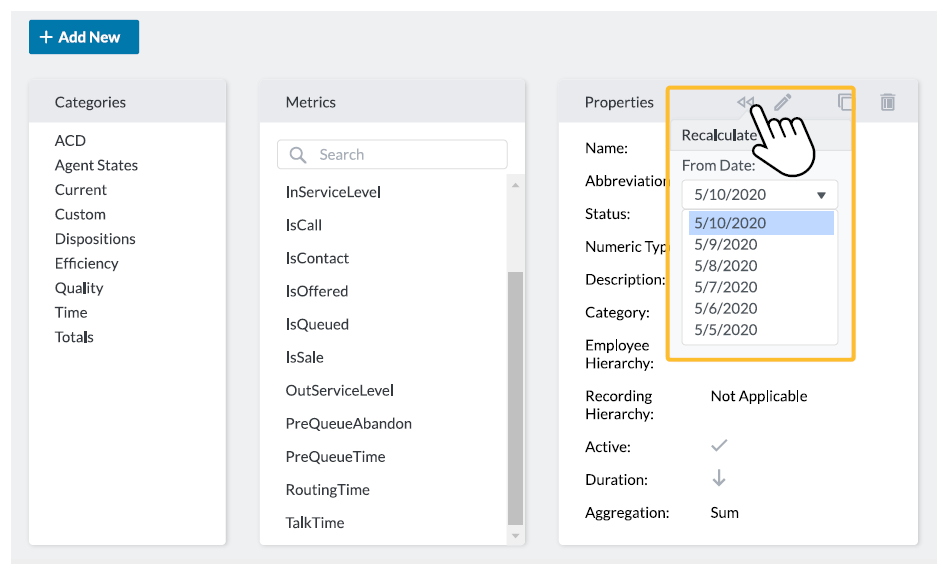
Recalculate Metrics
You can recalculate data for a metric created on the Pipeline Config page of the new (AX) platform. You can recalculate using data from up to 6 months in the past, and data can only be recalculated from the 1st day of a selected month. Note that if you recalculate a metric, historical data will also change in accordance to the recalculation.
- Navigate to the Metric Definitions tab of the Pipeline Config page (Data Config > Pipeline Config > Metric Definitions).
- Select a metric.
- Select the Recalculate icon in the metric's Properties box (indicated by a reverse arrow).
- Confirm the warning.
Create Metrics
The following sections apply if you have not migrated onto the new platform.
Configure New Metric
- Click Data Config. > Metrics.
- Click the Add icon (indicated by a plus sign in a blue circle).
- Type a Name and, optionally, a Description for the metric.
- For Metric Group, select from the drop-down list of metric groups in your system. Your selection is the category in which the metric will appear in the module metric selector.
- Configure category-specific settings. For example, metrics in the Product category include a Metric Security field, while metrics in the Time category let you configure the unit of Time.
- You can give the metric an Abbreviation.
- You can select a Divisor from the drop-down list. These values allow you to use other custom and base metrics to calculate additional metrics. For example, for a metric called Average Hold Time, you would divide total hold time by number of calls. In this case, you would select Calls as the Divisor. If you leave this field at the default value of None, the metric you create can be used as a divisor for other metrics.
- You can type a numeric value for Multiply By. This field is commonly used to multiply by 100, thus making small percentages easier to read.
- Click the blue arrow to set the metric Direction. This setting determines whether the metric should trend higher or lower. For instance, most companies want average handle time to trend lower while product conversion should trend higher.
- You can select an image icon to appear with the metric.
- Click Create.
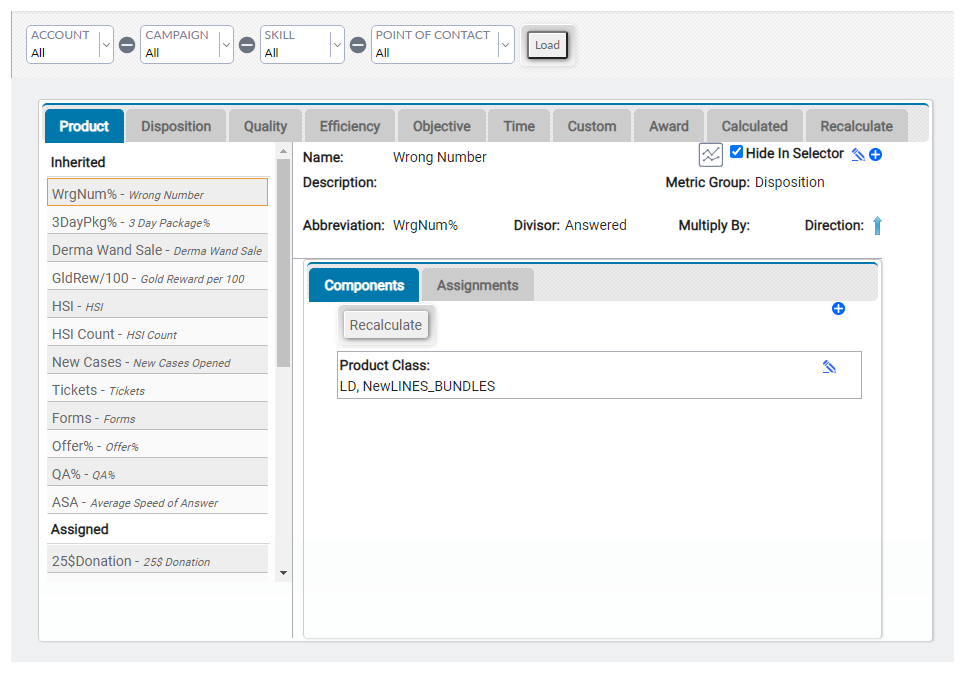
Add Components to Metrics
- Click the Components tab for the metric.
- Click the Add icon (indicated by a plus sign in a blue circle) in the top right corner of the Components tab for the metric.
- Select from the drop-down lists at each level (hierarchy of data).
- Click Create.
Assign Metrics
- Click the Assignments tab to assign the metric to a user group or campaign.
- Click the white arrow to the left of the names to view the associated subcategories.
- Expand the necessary Point of Contact categories to find the desired group.
- Click the add button (indicated by a + symbol) for each entity you want to assign the metric.
- You can select the Assign All box to make the metric available to all groups.